Module 12 Getting Data
12.1 Search for data sets
There are number of websites that are repositories of data sets. Here’s a list of some resources:
Kaggle Data Sets https://www.kaggle.com/datasets
Google Dataset Search https://datasetsearch.research.google.com/
U.S. Department of Education Public Data Listing https://www2.ed.gov/about/data/list.html
US Department of Health and Human Services, Datasets & Research Resources https://www.nichd.nih.gov/research/resources/index
City of Tucson Open Data https://gisdata.tucsonaz.gov/
12.2 Extracting data tables from websites
Other times you will find data available in webpages, or in HTML format. Lucky for us again, there’s an R package to extract tables from html files.
As usual, we need to install the package first.
Remember we need to install a package only once (and updated it once in a while), but every time we want to use it, we need to call it with the library() function.
##
## Attaching package: 'rvest'
## The following object is masked from 'package:readr':
##
## guess_encodingLet’s check what tables there are in UArizona’s wikipedia page.
First, we need to read in the html file.
We now parse the html for tables.
## {xml_nodeset (19)}
##  [1] <table class="infobox vcard">\n<caption class="infobox-title fn org">Uni ...
##  [2] <table class="multicol" role="presentation" style="border-collapse: coll ...
##  [3] <table class="infobox" style="width: 22em"><tbody>\n<tr><th colspan="2"  ...
##  [4] <table class="wikitable sortable collapsible collapsed" style="float:rig ...
##  [5] <table class="wikitable sortable collapsible collapsed" style="float:rig ...
##  [6] <table style="float:right; font-size:85%; margin:10px" class="wikitable" ...
##  [7] <table role="presentation" class="mbox-small plainlinks sistersitebox" s ...
##  [8] <table class="nowraplinks hlist mw-collapsible mw-collapsed navbox-inner ...
##  [9] <table class="nowraplinks mw-collapsible mw-collapsed navbox-inner" styl ...
## [10] <table class="nowraplinks mw-collapsible mw-collapsed navbox-inner" styl ...
## [11] <table class="nowraplinks mw-collapsible autocollapse navbox-inner" styl ...
## [12] <table class="nowraplinks mw-collapsible autocollapse navbox-inner" styl ...
## [13] <table class="nowraplinks navbox-subgroup" style="border-spacing:0"><tbo ...
## [14] <table class="nowraplinks mw-collapsible autocollapse navbox-inner" styl ...
## [15] <table class="nowraplinks mw-collapsible autocollapse navbox-inner" styl ...
## [16] <table class="nowraplinks mw-collapsible autocollapse navbox-inner" styl ...
## [17] <table class="nowraplinks mw-collapsible autocollapse navbox-inner" styl ...
## [18] <table class="nowraplinks mw-collapsible autocollapse navbox-inner" styl ...
## [19] <table class="nowraplinks hlist navbox-inner" style="border-spacing:0;ba ...
Too many tables. We can be specific, and retrieve nodes per class.
## {xml_nodeset (3)}
## [1] <table class="wikitable sortable collapsible collapsed" style="float:righ ...
## [2] <table class="wikitable sortable collapsible collapsed" style="float:righ ...
## [3] <table style="float:right; font-size:85%; margin:10px" class="wikitable"> ...
This looks a little better.
It looks like the table we want is the third table.
# create wiki_tables object
wiki_tables <- uarizona_wiki_html %>%
  html_nodes(".wikitable")

# transform node into an actual table
fall_freshman_stats <- wiki_tables[[3]] %>%
  html_table(fill = TRUE)

# check data
fall_freshman_stats
## # A tibble: 7 x 6
## `` `2017` `2016` `2015` `2014` `2013`
## <chr> <chr> <chr> <chr> <chr> <chr>
## 1 Applicants 36,166 35,236 32,723 26,481 26,329
## 2 Admits 28,433 26,961 24,417 20,546 20,251
## 3 % Admitted 78.6 76.5 74.6 77.5 76.9
## 4 Enrolled 7,360 7,753 7,466 7,744 6,881
## 5 Avg GPA 3.43 3.48 3.38 3.37 3.40
## 6 SAT range* 1015–1250 1010–1230 1010–1230 1000–1230 990–1220
## 7 * SAT out of 1600 <NA> <NA> <NA> <NA> <NA>Tidy it.
# first column name is blank
colnames(fall_freshman_stats)[1] <- "type"

# pivot years
fall_freshman_stats <- fall_freshman_stats %>%
  pivot_longer(cols = "2017":"2013",
               names_to = "year")

# make value a number
fall_freshman_stats <- fall_freshman_stats %>%
  mutate(value = as.numeric(parse_number(value)))

# inspect data
glimpse(fall_freshman_stats)
## Rows: 35
## Columns: 3
## $ type <chr> "Applicants", "Applicants", "Applicants", "Applicants", "Applica…
## $ year <chr> "2017", "2016", "2015", "2014", "2013", "2017", "2016", "2015", …
## $ value <dbl> 36166.00, 35236.00, 32723.00, 26481.00, 26329.00, 28433.00, 2696…Plot it.
fall_freshman_stats %>%
  filter(type %in% c("Applicants", "Admits", "Enrolled")) %>%
  ggplot(aes(x = year,
             y = value,
             color = fct_reorder(type, value, .desc = TRUE))) +
  geom_point() +
  theme_bw() +
  geom_line(aes(group = type)) +
  labs(y = "student count",
       color = "")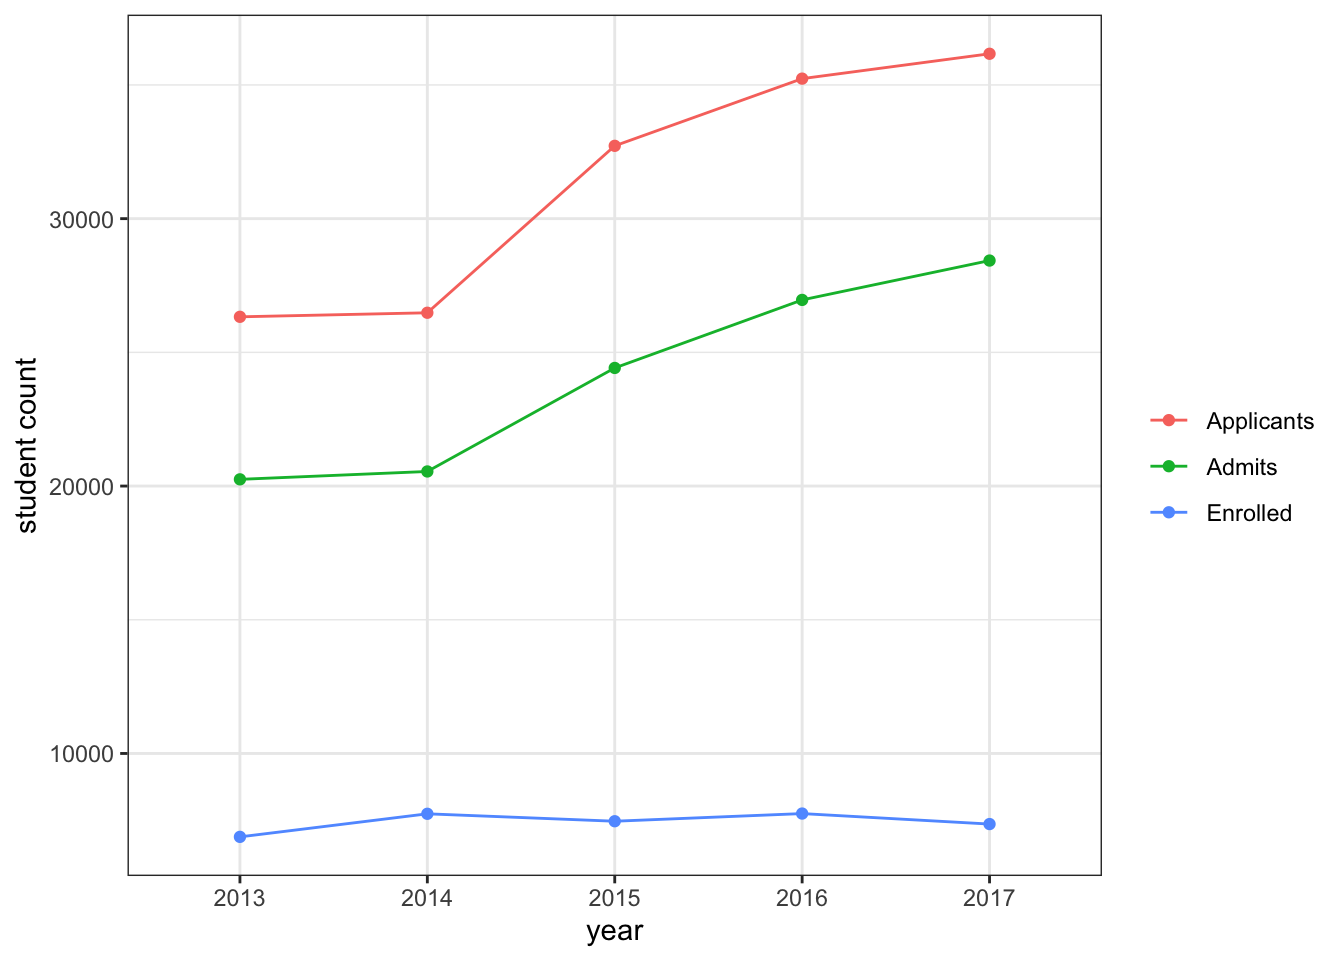
12.3 Project Proposal
Project Proposal is due April 06 2021.